Reducing Full Container Load Freight costs in 2026 will require more than requesting a lower ocean rate. Shippers must examine the entire movement, from factory loading to final delivery. A container can lose money through poor carton dimensions, unused cubic space, storage delays, or expensive destination charges.
Lars Jensen, founder of Vespucci Maritime and a respected container-shipping analyst, has said, “The container shipping industry is cyclical.” This observation matters in 2026. Freight rates may change quickly when capacity, fuel prices, port congestion, or trade demand shifts. A reliable cost strategy should therefore combine carrier comparisons, realistic booking forecasts, and careful contract reviews. Do not chase the cheapest quotation blindly. It may exclude documentation, terminal handling, chassis fees, or demurrage protection.
Small details create visible savings. For example, a shipper can measure every carton before booking and redesign pallets when safe. A 4% improvement in container utilization can reduce the number of annual containers. Consolidating compatible production schedules may also prevent half-empty loads. Yet consolidation is not always better. Longer factory waiting times can damage inventory planning. That trade-off deserves attention.
Experienced logistics teams should track cost per shipped unit, not only cost per container. They should also compare port pairs, sailing frequency, free-time terms, and transshipment risks. Keep written records. Question old assumptions.
The practical goal is controlled cost, not a perfect forecast. Markets remain uncertain. Even strong plans can fail during sudden disruptions. This guide explains how to build a more resilient Full Container Load Freight program, using measurable decisions, supplier evidence, and room for correction.
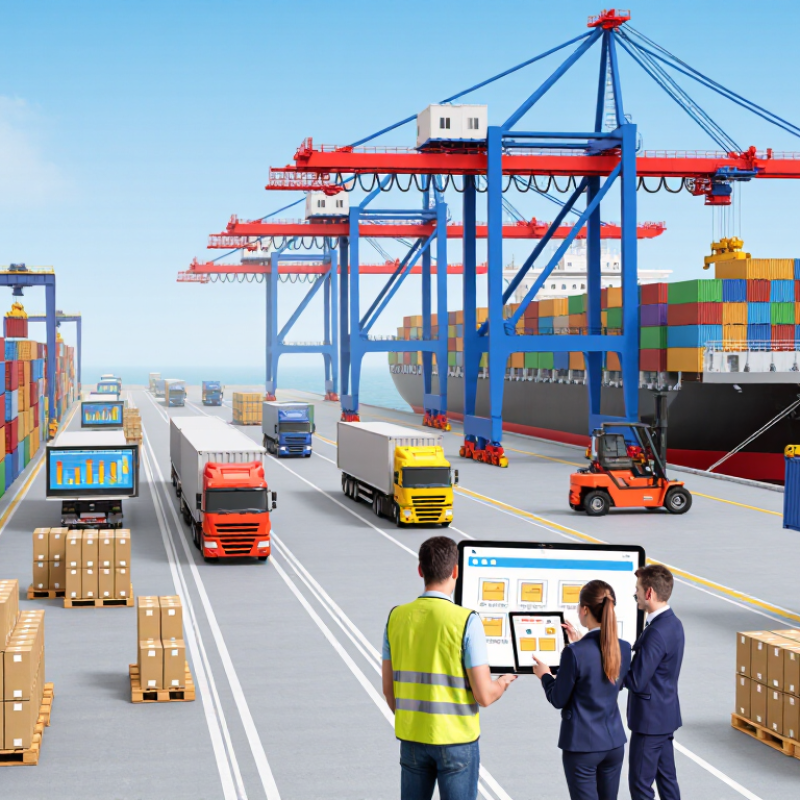
2026 FCL Cost Baseline: UNCTAD Says Sea Carries Over 80% of Trade
UNCTAD says more than 80% of world trade by volume moves by sea. That makes ocean freight central to supply chains, but it does not make every container shipment predictable. In 2026, an FCL quote is only a starting point. Fuel adjustments, port handling, inland transport, and seasonal demand can change the final bill. Compare the full, itemized cost—not just the headline ocean rate.
For a full container load, better planning often saves more than last-minute rate hunting. Match container size to the shipment, confirm cargo-ready dates, and leave room for realistic loading time. A half-empty container can erase savings from a low rate. So can missed cutoffs or unexpected storage charges. Ask providers to explain what the quote excludes, including destination fees and free-time limits. Small details matter.
Tips: Consolidate compatible orders when timing allows, and share accurate dimensions and weights before booking. Request quotes for the same route, container type, and service window. Track port schedules and arrange pickup early to reduce avoidable storage or detention costs. Keep a simple record of quoted and final charges; discrepancies can reveal patterns. This takes discipline, and forecasts still miss sometimes. Don’t treat the cheapest offer as the cheapest shipment.
Benchmark Lane Quotes with Drewry WCI and Freightos FBX Rate Indices
A full-container quote is useful only when compared with the right market reference. Drewry’s World Container Index (WCI) tracks spot prices on major routes, while the Freightos Baltic Index (FBX) provides lane-level container rate data. Their historical peaks show how sharply conditions can shift: Drewry reported a WCI of $10,377 per 40-foot container in September 2021, while Freightos data showed global spot rates exceeding $20,000 per FEU during the same disruption. These are historical benchmarks, not today’s prices.
For a current quote, match the index lane, container size, and sailing week as closely as possible. Then check what the quote includes: port handling, fuel surcharges, and inland transport can change the total. Compare at least four weekly readings, not one unusually high or low point. Drewry’s and Freightos’s figures can differ because their route coverage and methods differ. That gap matters. Use them to question a quote, not to assume your shipper should match a global average. A quote may still be high because space is tight or the sailing date is fixed. I would also record the quote’s expiry date; I have seen teams miss savings by comparing it with a rate from the wrong week.
2026: How to Reduce Full Container Load Freight Costs? — Benchmark Lane Quotes with Market Rate Indices
Use this comparison to check quote coverage, identify negotiation opportunities, and compare lane pricing against a consistent market-index reference. All figures below are illustrative planning examples, not live quotes or published index observations.
| Trade lane |
Equipment |
Example baseline quote (USD) |
Comparable target quote (USD) |
Potential difference |
Check before comparing |
Practical cost-reduction action |
| Shanghai, China → Los Angeles, United States |
40 ft standard dry |
$4,200 |
$3,900 |
$300 (7.1%) |
Confirm whether both quotes include origin and destination terminal handling, fuel-related surcharges, and documentation fees. |
Request a fixed-period rate and compare an alternate West Coast arrival option, including inland and transfer costs. |
| Ningbo, China → Rotterdam, Netherlands |
40 ft standard dry |
$3,500 |
$3,250 |
$250 (7.1%) |
Check that the quoted service, transit-time range, free time, and destination charges are equivalent. |
Share a rolling forecast and consolidate bookings to improve allocation planning and reduce last-minute booking premiums. |
| Shenzhen, China → New York / New Jersey, United States |
40 ft standard dry |
$5,100 |
$4,750 |
$350 (6.9%) |
Compare routing and transit time, and identify any canal-related, peak-season, or security surcharges separately. |
Price both direct and transshipment services; choose the lower total landed cost when schedule flexibility allows. |
| Busan, South Korea → Hamburg, Germany |
40 ft standard dry |
$3,200 |
$3,000 |
$200 (6.3%) |
Verify currency, rate validity, equipment availability, and whether destination handling is included. |
Compare multiple sailing windows and avoid premium-date departures when delivery requirements permit. |
| Ho Chi Minh City, Vietnam → Long Beach, United States |
40 ft standard dry |
$4,000 |
$3,720 |
$280 (7.0%) |
Check origin haulage, export documentation, terminal charges, and any cargo-specific fees. |
Review origin pickup arrangements and booking lead time; tender earlier to widen the choice of sailings and service options. |
How to use: Compare like-for-like 40 ft dry-container quotes with identical shipment dates, routing, service scope, and charge inclusions. Treat market-rate indices as directional benchmarks rather than guaranteed bookable prices; validate the final total with current written carrier or forwarder quotes. Example differences are calculated from the illustrative figures shown and are not guaranteed savings.
Price Route Disruption: Cape Rerouting Adds About 3,500 Nautical Miles
# 2026 How to Reduce Full Container Load Freight Costs?
Price route disruption can quickly change the cost of a full container load. When vessels reroute around the Cape, a voyage may add about 3,500 nautical miles. That extra distance means more fuel, longer transit times, and less predictable arrival dates. A container that once fit a tight production schedule may now sit at sea for weeks longer. It’s not just the freight quote that matters.
Ask carriers or freight providers how the quoted route is planned, and whether the rate includes disruption surcharges. Compare the full landed cost, not just the base ocean rate. Longer voyages can also tie up working capital: goods remain in transit while inventory buffers grow. For example, a furniture importer might bring forward a small portion of a seasonal order rather than rush the entire shipment later. This can reduce exposure to urgent, expensive bookings, though it may increase storage costs.
Build extra time into delivery plans and review shipment milestones regularly. Check sailing schedules, transshipment points, and free-time terms before cargo is released. Small details count. Route estimates can change, and a spreadsheet will not catch every delay. Even so, comparing realistic transit options and avoiding last-minute bookings gives shippers more control over FCL costs.
How Cape Rerouting Can Affect Full Container Load Freight Costs
An additional 3,500 nautical miles is approximately 6,482 km (using 1 nautical mile = 1.852 km).
Longer routing can increase sailing time and fuel use, affecting total freight costs. When comparing FCL quotes, check the validity period, surcharges, and whether the quoted route reflects current disruptions.
Reduce Accessorials by Auditing THC, D&D, and Demurrage Free-Time Terms
Full-container-load costs can rise through small accessorial charges that are easy to overlook. Audit terminal handling charges (THC) against the agreed rate sheet and each shipment invoice. Check whether origin and destination THC are listed separately, charged per container, or included in another quoted fee. A mismatch on one invoice may seem minor. Repeated across several containers, it deserves attention. Keep the booking confirmation, invoice, and terminal receipt together for each shipment.
Then review demurrage and detention terms alongside the actual free-time clock. Demurrage generally relates to containers held at the terminal; detention typically applies after equipment leaves the terminal. Verify when free time begins, whether days are calendar or working days, and what timestamp marks pickup or return. A one-day difference can change the bill. Compare those terms with gate records, release notices, and return receipts before approving charges. Ask the carrier or forwarder to explain any unclear line item in writing.
A spreadsheet helps, but it cannot explain every delay. Records may be incomplete, and our first reading of a clause can be wrong. Flag uncertain cases rather than assuming every charge is invalid. A consistent monthly audit can reveal recurring fees and support more precise contract discussions.
Conclusion
Reducing Full Container Load Freight costs in 2026 requires a practical approach to capacity planning, route selection, and contract review. Ocean shipping continues to carry more than 80% of global trade, making container efficiency especially important. Shippers should compare 20-foot and 40-foot options based on cargo volume, weight, and loading flexibility. A typical 40-foot container can carry approximately 26.5 tonnes, but selecting the right size helps avoid wasted space and unnecessary charges.
Cost control also depends on reliable market benchmarking. Compare lane quotations with recognized container freight rate indices, while accounting for route disruptions and possible Cape rerouting, which may add roughly 3,500 nautical miles. Finally, audit accessorial charges carefully, including terminal handling fees, detention and demurrage rates, and free-time provisions. Clear contract terms, accurate shipment planning, and early review of route risks can significantly improve cost predictability and reduce avoidable expenses.